Visualization using
Tableau
Tableau dashboard of bike store.
Summary
This dashboard provides a comprehensive overview of the performance of a bike store. The dashboard includes a variety of visualizations, such as line graphs, bar charts, and pie charts, to display key metrics such as sales, profits, and inventory levels.
Reports and Dashboards
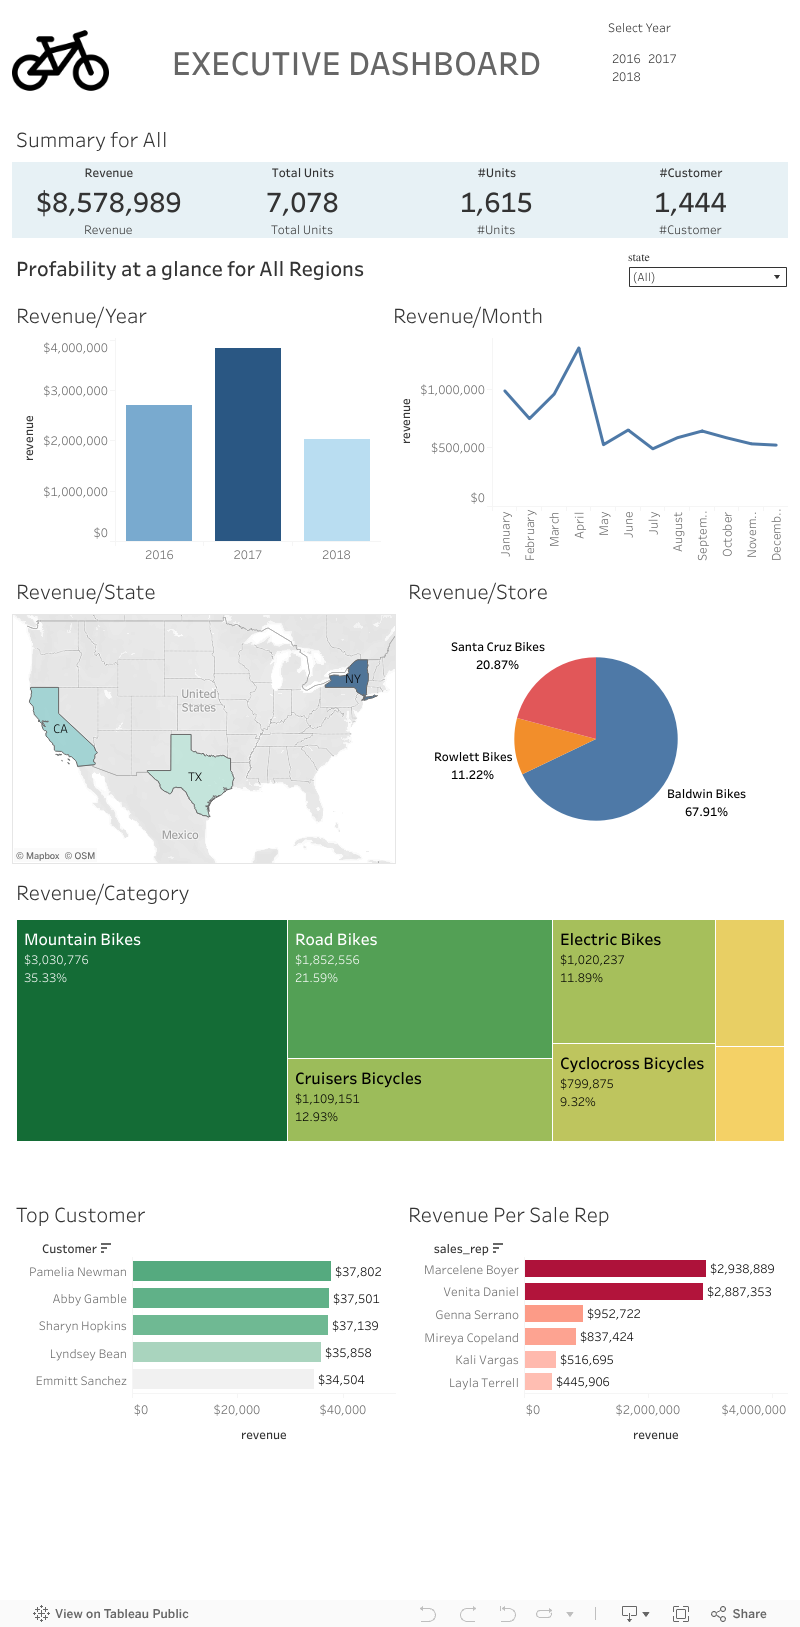
- Sales by product category: This line graph shows the total sales for each product category over time. The graph shows that sales of bikes have been increasing steadily over the past few years, while sales of accessories have remained relatively flat.
- Top-selling products: This bar chart shows the top 10 best-selling products over the past year. The chart shows that mountain bikes are the most popular product category, followed by road bikes and hybrid bikes.
- Sales by region: This pie chart shows the percentage of sales generated from each region. The chart shows that the majority of sales come from the North America region, followed by the Europe region and the Asia-Pacific region.
- Inventory levels by product category: This bar chart shows the current inventory levels for each product category. The chart shows that the bike store has a healthy inventory level for all product categories.
Analysis and Interpretation
- The dashboard shows that the bike store is performing well overall. Sales have been increasing steadily over the past few years, and the store has a healthy inventory level. The top-selling products are mountain bikes, road bikes, and hybrid bikes.
- The store could potentially increase sales by expanding its marketing efforts in the Europe and Asia-Pacific regions. The store could also consider offering discounts on accessories to boost sales in this category. ➨ Overall, the bike store is in a good position to continue to grow its business.